Sloppily Measuring the Effects of LZ4 Compression
Way back in 0.1.1 we added the ability to compress your data using LZ4. Since
I haven't written in a while and we'd never really measured the performance
aspects of using LZ4, I figured now was as good a time as any. Segfaults are
low, moral is high and coverity isn't yelling at
us too morosely.
We use LZ4 compression for a couple of reasons, mainly that it's fast and that
it reduces the memory required to store items both on-disk and in-memory. Ever
since I rewrote the database to use mmap() the second one hasn't really been an
issue, but on-disk compression is still something nice to have. Given how easy
LZ4 was to add to the project and how fast it is
this is basically a win-win.
Implementation
So, to get started I wrote a naive memory checking script in bash that you can look at here. The gist is that it uses Linux's smap subsystem that resides in/proc to grab memory usage of a process. I say naive
because the only thing I grabbed during the test was the total memory mapped to
the Erlang process. For our purposes this is more than enough.With the mem_check script running as fast as it could logging memory usage and a
millisecond Unix timestamp, I ran fill_fast() from torture.py
on 8 threads and let it go. fill_fast() creates random 16-byte strings and associates
them with random 100-byte values.
I ran two tests: One with OL_F_LZ4 enabled and one without. To speed up the
filling of the databases a little bit I also disabled OL_F_AOL_FFLUSH. This
avoids fflush()ing the AOL file to disk and puts it's trust into fsync().
Since this isn't a benchmark I'm not worried about time or anything, but just to be complete the test box is spec'd thus:
- FX-8350 Processor
- 8GB of DDR3 at 1600MHz
Results
First, let's look at memory usage over time without LZ4 compression: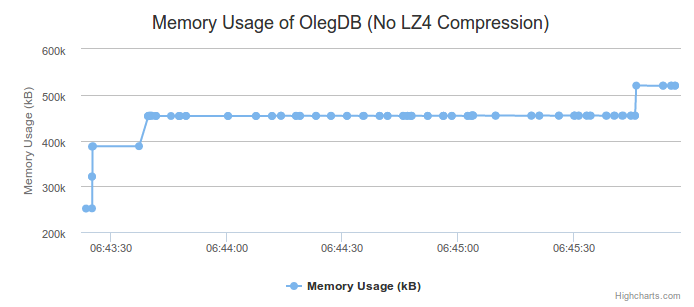
From the baseline you can tell that we start out usage at about 251,000kB and quickly hit our hash-table limit and rehash. This triggers a rough doubling in memory usage, which is what we expect. Towards the end of the test with 100,000 keys you can see we hit 520,000kB and stay there. Keep in mind that this is mapped memory and not necessarily used memory.
I took snapshots of memory quite frequently, my dataset has something like 40,000 points for the length of the each test. All this data isn't really necessary though so I removed all memoy snapshots that aren't unique on memory usage compared to the last known usage amount. This results in some unique properties when we look at the results of the test with LZ4 compression enabled:
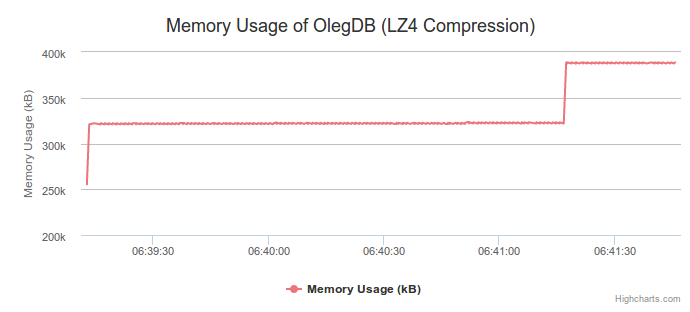
We get a much noisier line of memory usage, but a lowered range. This is kind of what I expect out of a compression algorithm: Small allocations in memory (or hopefully none) with better longterm results. We don't even broach 400kB here. Our baseline is slightly higher though, which is interesting.
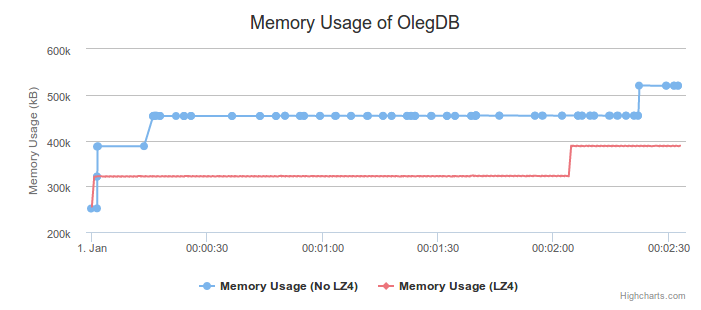
Conclusions
This test is mostly a birds-eye view of memory usage and should be taken with a grain of salt. If I were to do this again I'd definitely use better memory checking to maybe check what pages are allocated per process rather than just mapped.Mostly though the results are positive and I think if you're using Oleg you should enable LZ4 compression. For funsies here are the two graphs together: